

-
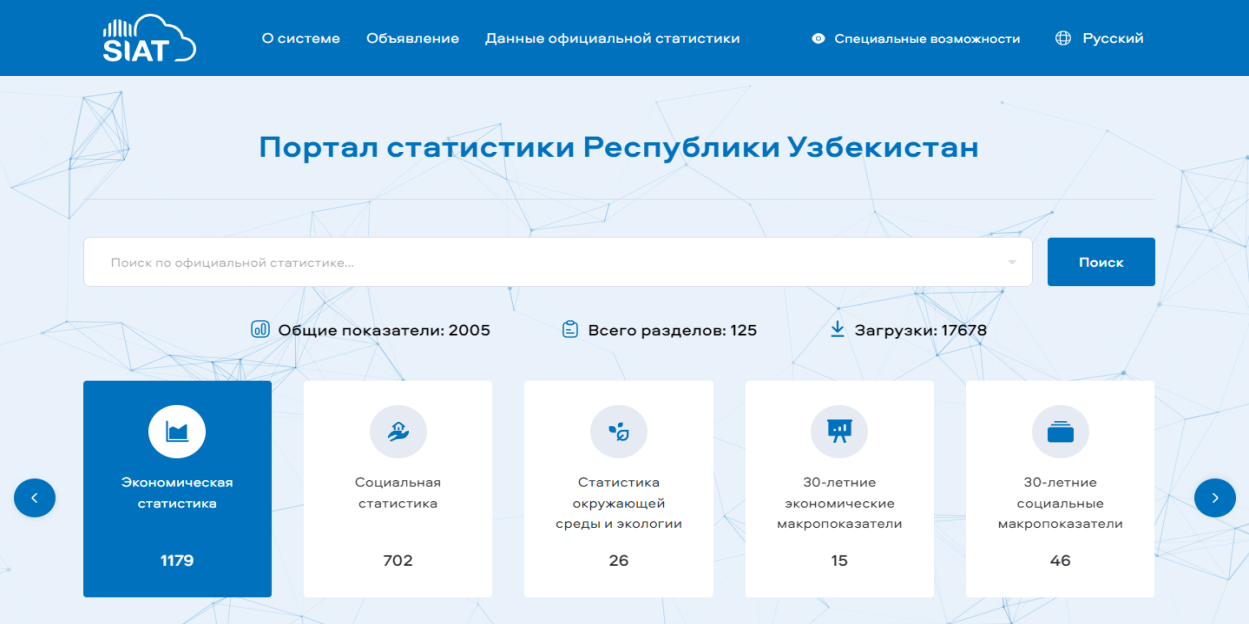
 12 directions, 91 sections, 3205 statistical indicators
-
Using open data in 5 different formats
-
Visualization of information in the form of tables, ratings, charts, cartograms, and graphs
-
Access to the latest regional statistics
-
Ability to use the AI consultant to get faster search for statistical information
The portalof the integrated information system “Statistics "is the only point of obtaining accurate, reliable and high-quality statistical information.It provides an opportunity to collect administrative statistical data through integration and provide users with statistical data inthe SDMX standard. Also, perform a number of actions:
First, until today, the statistical data stored in various sources and forms have been converted to a standard format that meets international recommendations, and collected digitally into a single database.
Second, modern database management systems have been implemented for comparison with classifiers and reference books, as well as for processing large amounts of data.
Third, it provides the ability to create summary information with data separation, by field of activity and region, and also introduces the module tables, graphs, charts, cartograms for visualizing information.
Purpose and objectives of the portal
- creation of a single database for providing accurate and high-quality information in the field of statistics;
- compilation of metadata (data passport) for each statistical indicator based on the SDMX international standard;
- data integration using the REST API technology.
- monitoring of data processing and exchange processes.
- providing an opportunity to get acquainted with statistical information in the form of tables, ratings, cartograms, graphs, comparisons, relationships, calculations, and a web service.
Статистика
3 231
91
772 945
1 735
1 361
74
15
46
-
 Ability to generate aggregated information by dividing statistical data into sections of industries and regions
-
Possibility of direct integration of statistical indicators
-
Availability of official statistics in 3 languages (Russian, English and Uzbek)
-
Ability to download official statistics in 5 different formats (PDF, XLSX, CSV, JSON, XML)
-
Ability to compare and analyze statistical data by industry and region
-
Ability to quickly find the necessary information through the advanced search engine
-
Providing various ways to visualize statistical data (graphs, tables, cartograms, etc.)
-
Ability to use an Ai consultant